Election Polls Unfiltered: What the Numbers Can and Can't Tell You
Election polls are snapshots, not crystal balls. Learn how they work, where they go wrong, and how to interpret their numbers with confidence.
The Polling Paradox
Every election season, millions of viewers stare at a single number: Candidate A leads by four points. It feels precise, almost scientific. Yet when the ballots are counted, that number sometimes crumbles into dust. Why do polls so often seem to get it wrong? And more importantly, what can we actually learn from them?
The disconnect is not because pollsters are lazy or incompetent. The truth is more subtle. Election polls are rarely designed to predict a winner; they are designed to describe a given moment in time. That distinction matters enormously. When seen through the right lens, polls are powerful tools. When misinterpreted, they become misleading noise.
What Exactly Is an Election Poll?
At its core, an election poll is a snapshot of public opinion. Researchers survey a small group of people, known as a sample, to represent the thinking of the entire electorate. The goal is not to count every voice but to capture a statistically reliable cross-section.
But a poll is never a final verdict. It tells you how people feel today, not how they will feel on election day. Campaigns shift, scandals erupt, debates change minds, and voters forget to show up. Polls merely stop the clock and show you the score at that instant.
That is why experts cringe when television anchors announce, “This poll shows who will win.” The phrase overstates what the data actually represents. A responsible interpretation is: “If an election were held today, this candidate might win – within a certain margin of error, under certain assumptions.”
The Mechanics Behind the Magic
To understand a poll, you must understand its three pillars: sample size, margin of error, and weighting.
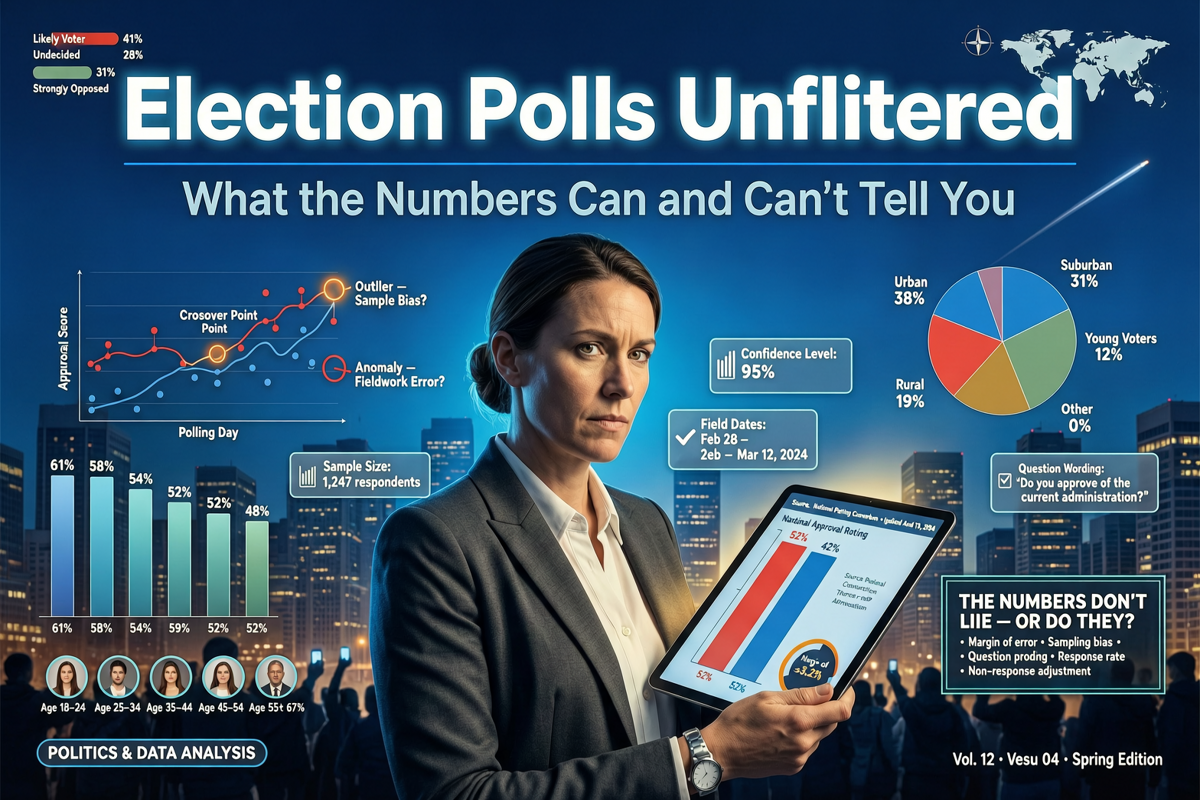
Sample size refers to the number of people surveyed. Generally, a sample of 1,000 voters yields a margin of error of about plus or minus three percentage points. That sounds straightforward, but it means that a five-point lead could actually be anywhere from two to eight points – still a lead, but not as clear as it appears.
The margin of error is also often misinterpreted. It applies to each number individually, not the spread between candidates. If Candidate A is at 48% and Candidate B is at 45%, with a margin of error of 3%, the true difference is not simply 3 points. Each number could shift by 3 points in either direction, meaning the gap could be as large as 9 points or as small as zero – a tie.
Weighting is the statistical correction process that adjusts the sample to match the broader electorate. If your sample has too many older respondents, you down-weight their responses. If it has too few young people, you up-weight them. The problem is that pollsters have to guess what the “correct” demographic makeup of the actual voter pool will be. Sometimes they guess wrong, with disastrous results.
Why Polls Go Wrong
Even with perfect math, polls fail for reasons that have less to do with numbers and more to do with human behavior. Here are the most common culprits:
- Sampling bias: The sample does not represent the full electorate. Older voters are easier to reach by telephone, while younger voters are often missed.
- Nonresponse bias: People who answer poll calls are not identical to people who screen them out. They may have different political habits or stronger opinions.
- Timing: Polls taken a month before an election can become irrelevant overnight. Undecided voters tend to break disproportionately in the last week.
- Likely voter models: Pollsters must decide who is actually going to vote. This prediction is an art, not a science, and small errors in turnout assumptions can flip a race.
- Social desirability bias: Some voters lie or hesitate to express unpopular opinions, especially face-to-face or on the phone. In the era of polarized politics, this can skew surveys in unexpected ways.
Each of these factors can introduce error, and errors compound. A poll may have a listed margin of error of 3%, but the real-world uncertainty is often larger.
The 2016 and 2020 Wake-Up Calls
The 2016 U.S. presidential election is the classic case study in polling failure. National polls showed Hillary Clinton ahead by a comfortable margin, and most state-level polls had her winning the Rust Belt states that ultimately flipped. In the aftermath, post-mortems revealed that many polls had under-sampled rural voters, over-weighted college-educated whites, and failed to account for the late surge of undecided voters.
In 2020, national polls were more accurate, but state-level biases remained. Many polls overstated the Democratic margin in key battlegrounds, leading to a surprise delayed count. The lessons were clear: polls are imperfect tools, and the more granular you get, the more fragile they become.
How to Read Polls Like a Pro
So how can you avoid being misled by the next poll that lands in your feed? Follow these practical rules:
- Ignore single polls. One outlier tells you almost nothing. Instead, look at polling averages that combine many high-quality polls over time.
- Watch trends, not points. A candidate who moves from 42% to 45% in a month is gaining momentum – that trend matters more than the absolute number.
- Check the fundamentals. Look for the sample size, margin of error, and how the poll was conducted. A reputable pollster will share this information openly.
- Distinguish between registered and likely voters. Likely voter numbers are more accurate but rely on fuzzy projections. Registered voter numbers are broader but over-state turnout.
- Consider the context. Polls taken after a convention or major debate are often exuberant. Wait for the dust to settle.
Getting comfortable with uncertainty is part of becoming information-literate. Polls are like a weather forecast: they tell you the most likely path, but they don’t guarantee rain.
The Future of Polling
The polling industry is not standing still. After a decade of high-profile misses, researchers are experimenting with new methods to improve accuracy. Here are a few innovations to watch:
Online panels have largely replaced telephone surveys, offering broader coverage and lower costs. However, online panels bring their own biases – people who volunteer to take surveys are not exactly a cross-section of democracy.
Multimode surveys combine texts, emails, and live interviews to reach a more diverse audience. This approach can reduce nonresponse bias but increases complexity.
Adjustments for education have become more common, since pollsters learned that traditional weights based on age and race missed the rising importance of educational attainment as a political divider.
Perhaps the most promising development is the increased transparency around statistical margins of house-effects. Aggregators like FiveThirtyEight and others now weight pollsters based on their track record, giving more influence to outfits that have been historically accurate.
Conclusion: The Poll Is Not the Story
Election polls are valuable precisely because they are honest instruments. They measure a messy, changing reality with an array of biases and imperfections. When we demand more from them than they can deliver, we set ourselves up for disappointment.
The next time you see a poll headline, resist the urge to read it as prophecy. Look at the trend, check the methodology, and remember that the only poll that truly counts is the one that happens on election day. That is where the story actually begins.